
 by Senior Analyst Ryan Fukumori
One of the most tragic aspects of COVID-19 is how the pandemic has exacerbated existing racial and class disparities across the United States. Black and Latino communities nationwide have suffered the health and financial consequences of the pandemic, facing heightened rates of illness and death from the novel coronavirus as well as widespread income and wealth loss. The San Francisco Bay Area has followed these trends. Many local low-wage communities of color have faced the dual injustice of major income losses and increased exposure to COVID-19 for those unable to work from home, as a 2020 UCSF testing study in the Mission District found.
Alarmingly, regional data on jobs growth since the start of the pandemic suggests that economic recovery in San Francisco still threatens to widen these income and wealth gaps, as net job creation has been in sectors where Latinos and other people of color are highly underrepresented. Meanwhile, most industries with high levels of Latino participation, such as service and transportation jobs, have yet to fully rebound from pandemic-related job losses. Economists and social scientists have warned about the consequences of a “K-shaped recovery” from the pandemic, where economic gains largely benefit high-wage workers and fail to improve the circumstances of working-class families. The available data suggest that San Francisco is experiencing this kind of stratified, inequitable recovery process.
The state of California’s Employment Department Division (EDD) publishes monthly updates on employment, separated by occupation and industry, for all different areas of the state. Figure 1 displays these data for San Francisco and San Mateo Counties, showing the growth or loss of jobs for each occupational category over an 18-month period, January 2020 to July 2021. Whether you look at the net change in jobs or the percent change in jobs over this timeframe, the outlines of a K-shaped recovery become clear. While jobs in food services, hospitality, personal care, transportation, and other service industries have yet to rebound to their pre-pandemic totals, higher-wage jobs in information, tech, and business management have actually increased in number since this period.
Note: All of the graphs on this blog post are interactive! You can hover over the bar graphs for more information, and in Figure 1, you can rearrange the data by clicking on the small black icon that pops up when you hover over any of the 3 underlined headers.
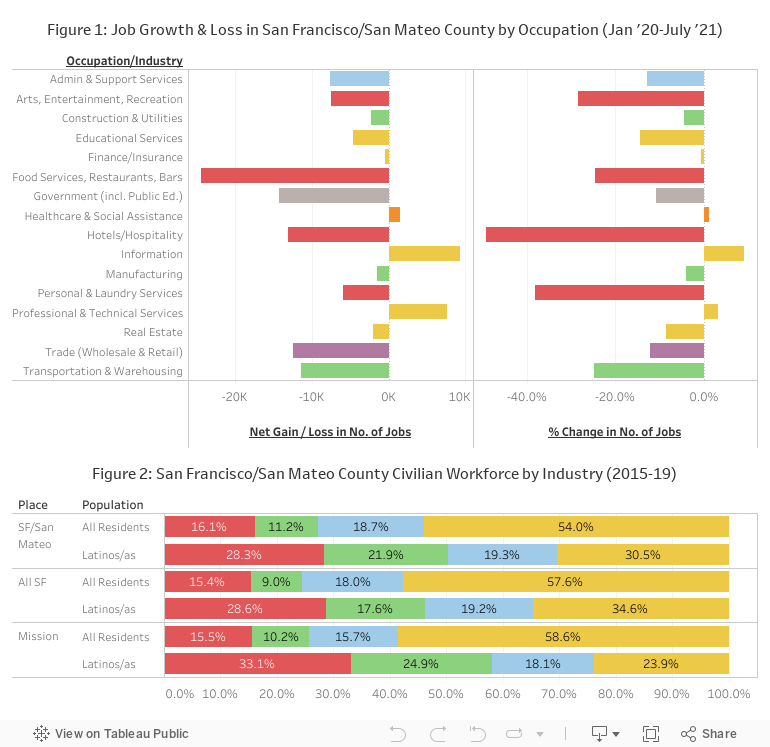
While these local jobs data are not disaggregated by race and ethnicity, we can compare these figures to demographic data from before the COVID-19 pandemic. Figure 2 draws from the most recent version of the American Community Survey, which combines data from 2015 to 2019. As seen here, Latino workers in San Francisco were disproportionately concentrated in those same service industries that have yet to fully recover their job losses, and highly underrepresented in the professional and business sectors that have seen limited losses or even growth. These trends were even more severe for Latinos living in the Mission District: while over half of all San Franciscans work in professional, business, and technical jobs, these fields employed only one-third of Latinos citywide, and fewer than one-quarter of Latinos living in the Mission District. While these two datasets do not categorize occupations in the same way, both graphs use the same color coding to show which fields in Figure 1 correspond to Figure 2’s categories.*
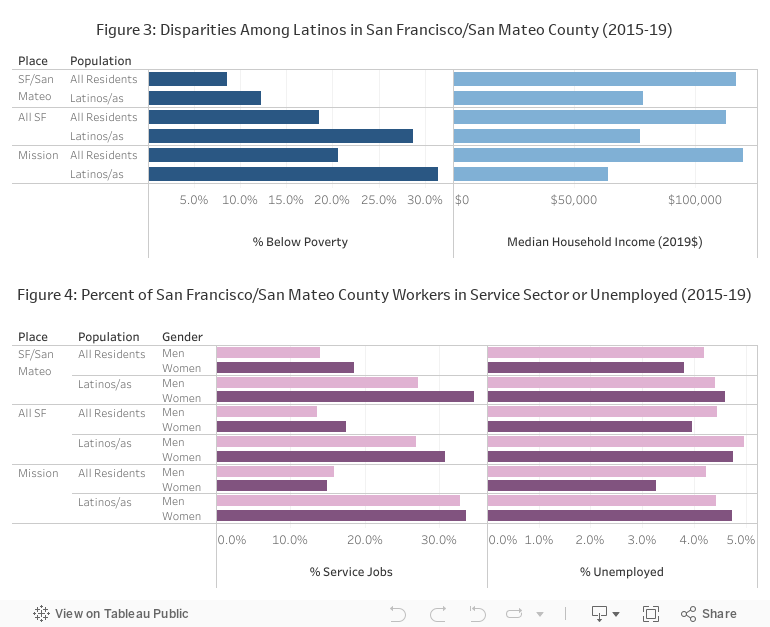
This divide between professional job growth and service sector job loss since early 2020 is all the more alarming, as they threaten to worsen longer-term socioeconomic rifts underway in the Bay Area since at least the dot-com boom of the late 1990s. Prior to COVID-19, the proliferation of high-wage tech, finance, and STEM jobs fueled the displacement of many low-income families of color from their longtime neighborhoods and heightened many more families’ financial precarity as costs of living rose. As Figues 3 and 4 show, Latinos across San Francisco and in the Mission District in 2015-2019 witnessed significantly higher unemployment and poverty rates, compared to all residents, and substantially lower median household incomes. Figure 4 also demonstrates the need for more intersectional analyses within Latino communities, as Latina women were more likely to be employed in service industries compared to Latino men, and Latinas nationwide have experienced particularly acute job losses
Socioeconomic data that MEDA gathered from thousands of community members during the COVID-19 pandemic further demonstrates the severity of financial hardship among many low-wage Latino families. Among people seeking services from MEDA during the pandemic, the vast majority of whom are Latino, 68.4% reported that they had lost their job, and over three-quarters of those surveyed indicated they were ineligible for federal stimulus checks or other public benefits. In a February 2021 survey of community members in San Francisco’s Supervisory District 11, only 23.5% of Latino respondents noted that neither they nor their spouse had lost income during the pandemic.
In other words, these recent trends in inequitable job growth only threaten to make what was already an uneven playing field even less fair, as many workers with months of lost wages and unpaid rent face a job market that is less accessible than it was 18 months ago.
No one action or solution is enough to counteract these alarming trends, and to advance an inclusive and equitable pathway to post-COVID recovery that addresses the structural disparities in place long before 2020. However, a few key steps along this pathway are:
- Pushing for more funds in rental relief and other benefits, especially programs accessible regardless of immigration or citizenship status. In the shorter term, it will be crucial that workers who lost their jobs or lost income during the pandemic do not fall further behind on losing savings, accruing debt, and/or risking eviction due to months of unpaid rent. San Francisco and California’s rental relief programs have been essential in this regard, and should serve as a foundation for additional subsidy programs for financially imperiled residents. It is especially important to find additional funding sources accessible to immigrant community members, especially those who are undocumented, given that they are routinely ineligible for public benefits programs.
- Taking a two-pronged approach to workplace development. Workforce development programs like MEDA’s own Mission Admins and Mission Techies can prepare community members to be competitive applicants for jobs in those professional sectors that have experienced smaller net job losses or net gains in the past few years. At the same time, it is important that we also advocate for policies and other public initiatives that enable robust small business development and living wages for workers across all occupations and industries. Service-sector job growth for the sake of job growth is not enough: We must confront the structural barriers that inhibit so many low-wage workers from achieving upward mobility.
- Partnering with advocates, providers, and community members from other historically underserved communities hit hard by COVID-19. Latinos in San Francisco are not alone in their adverse experiences during the COVID-19 pandemic. Other Black, indigenous, Asian American and Pacific Islander communities in the Bay Area and beyond have suffered similarly high rates of infection and financial loss. The regional K-shaped recovery is a challenge that we all face. As such it will be crucial to build and extend those partnerships across marginalized communities to advance equitable recovery policies and resource streams that are available and beneficial to all.
______________________________
*Note: Figure 1 has some extra colors because some of its occupational types map onto two different Figure 2 categories. “Trade” is purple because it includes jobs in both service industries (red) and sales/office administration (blue); “Healthcare and Social Assistance” is orange because it includes both service (red) and professional/technical (yellow) jobs; “Government” is gray because it is a broad sector that includes jobs from all Figure 2 types. Notably, the vast majority of public-sector job losses came from educational personnel.


Leave a reply